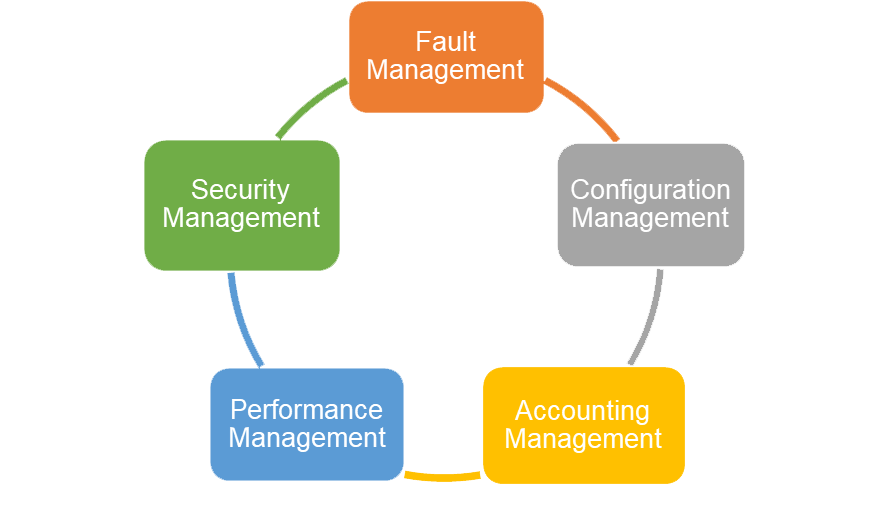
Cyber Monitor Five Network Management Functions

1.Fault Management
Auto-detection, Auto warning, Log report, Issue tracking
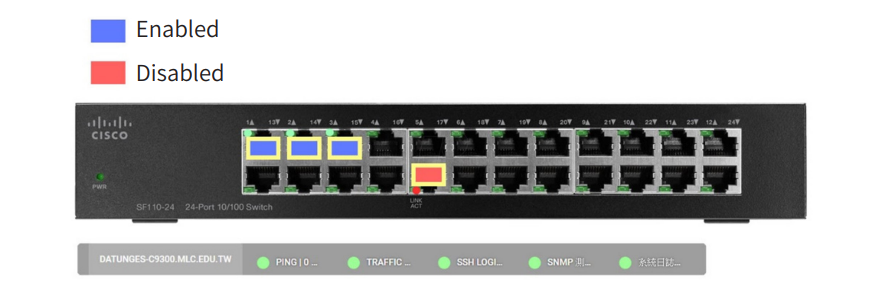
2.Configuration Management
Setting the behavior on ports or devices such as enabled/disabled switch ports
and blocked selected Mac/IP addresses. Auto backup configuration of device
and comparison difference. Dispatch script to multiple devices
3.Accounting Management
Statistics traffic of the particular IP and system for billing or expansion
purposes
4.Performance Management
Monitoring for all kinds of measurements on the device, such as traffic, CPU,
RAM, Jitter, MOS, RTT, CRC…etc.
5.Security Management
User management & Authorization, Resource Control, Analysis of log report of
the firewall
Active Directory integration
Existing accounts can be integrated to log into the network management
platform, such as LDAP, AD, OpenID...etc. No additional account numbers and
passwords are required
Centralized management of multiple tenants
To establish a network of enterprises/institutions/campuses with a tree
structure. Building network architectures include Gateway, DMZ, Routers,
VLANs, etc. Account permissions can be set for each management
Unlimited license
Unlimited authorization can be stable and manage 500 to 1000 devices, 1000
to 2000 or more can also be monitored for optimization management, and
more than 2000 can also be monitored through the horizontal expansion of
equipment
Device status monitoring
Monitor the health status of hardware, software, and network activities,
including CPU, MEMORY, TRAFFIC, etc.
Early warning function
Automatic detection of networks, device values of unusual fluctuations early
warning, rather than waiting for obstacles to notify, and automatically block
abnormal IP traffic.
Automate discovery management
Scheduled scanning of devices in the network segment used the automatic
discovery to loop-in devices, managed without manual settings, and regularly
scheduled backup device configuration profiles, which can be compared to the
differences.
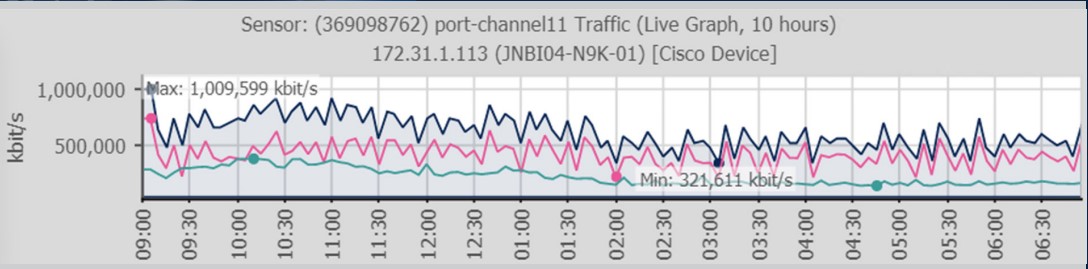
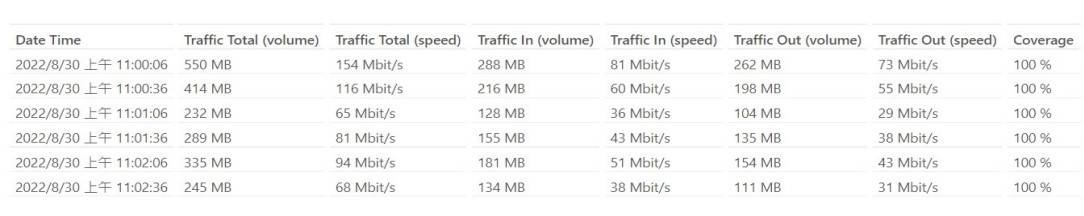
Real-time traffic monitoring
Real-time monitoring of network traffic utilization, and through the traffic chart
to show the maximum and minimum value, query each client IP network usage
and FLOW network connection source and destination flow
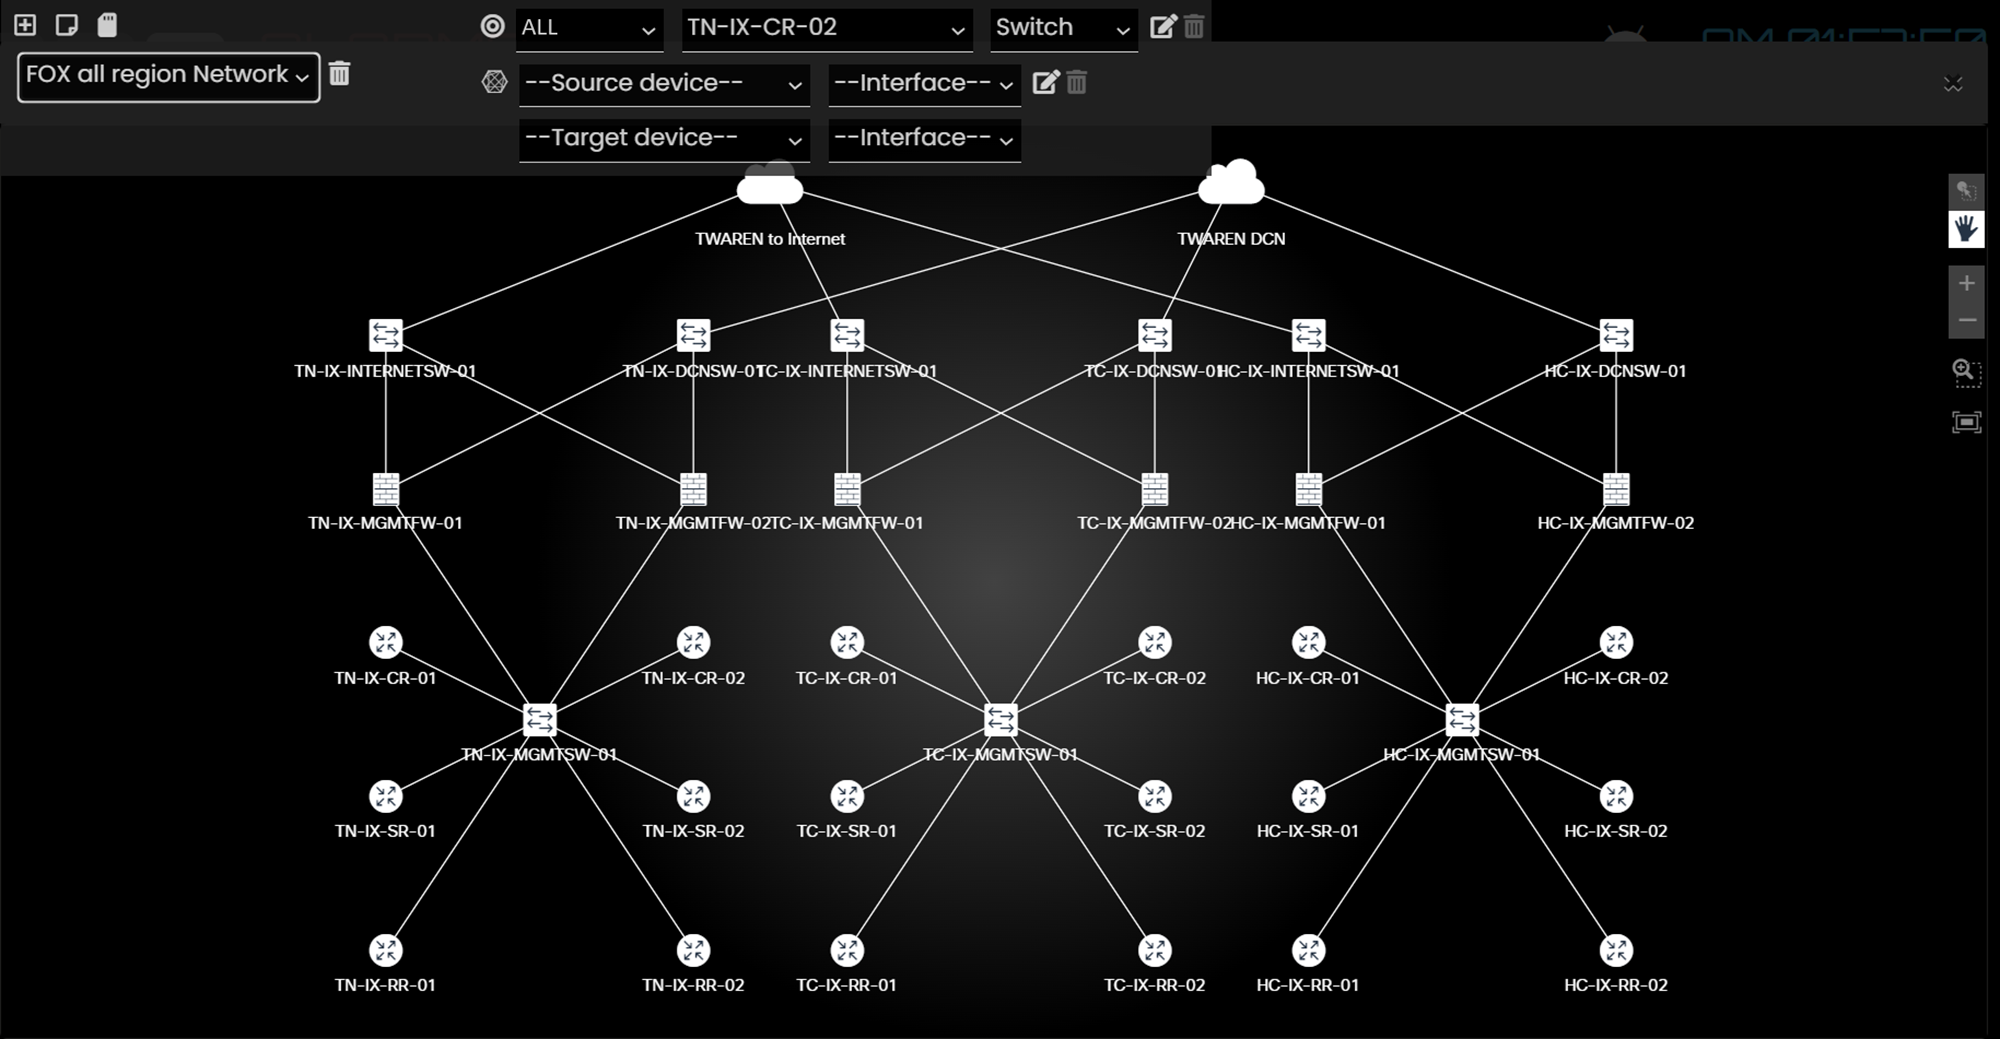
Network topology (Pro Version)
Automatically detect the connectivity of monitoring devices and draw network
topology diagrams to visually view the monitoring status of the device and the
status of the connection between the devices.
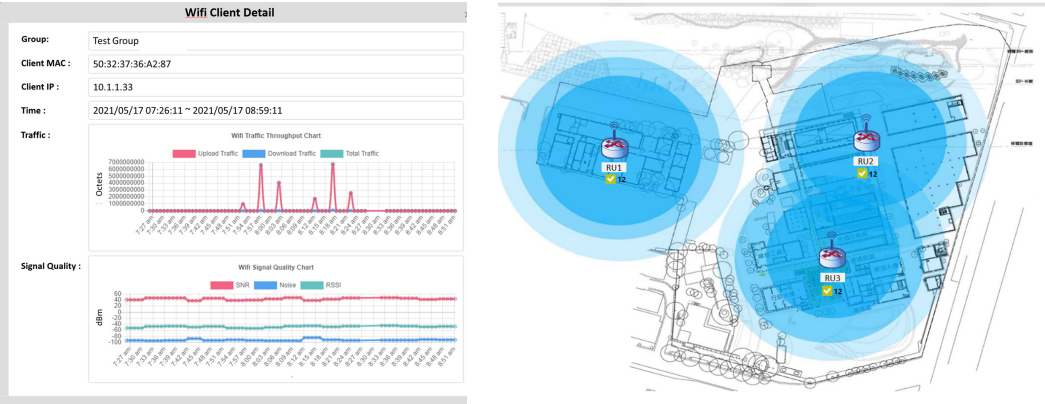
Wireless network monitoring (Plus Version)
Overview of the WIFI situation of user usage, analyze WIFI traffic of user usage,
device type, application distribution, and signal strength, support loading
the floor plan of the enterprise to generate a heat map and provide the
administrator with a visual view of AP status.
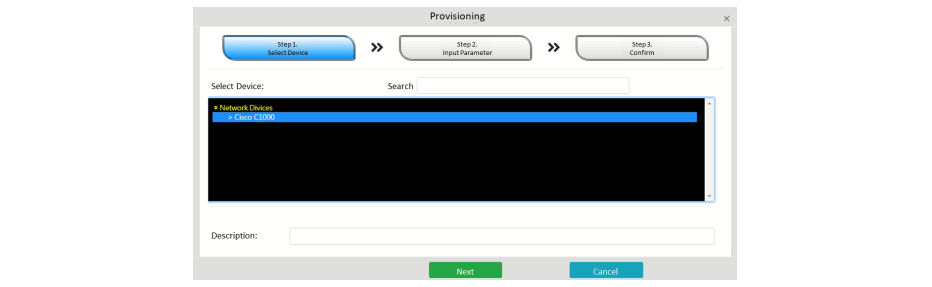
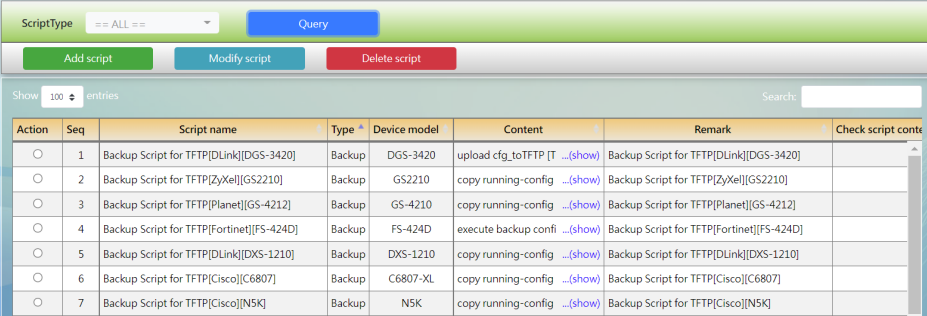
Self-defined Script dispatch (Pro Version)
Self-defined script commands can dispatch to different brands and mass
equipment to execute to achieve batch modification, such as account and
password of equipment, SSID, IPMAC binding, and other purposes. It only uses a
unified interface that can operate all equipment, default several device models
script including IP, MAC, Switchports enable or disable which scripts can control
these.
Customized equipment monitoring templates/items (Pro Version)
Simulation device panel to see real-time port usage - connected, disconnected,
enabled, disabled, and monitoring data. We have customized services to
provide monitoring templates for special devices such as DB, VMs, service
devices, etc. Of course, to let the enterprise administrator understand important
service data.
Historical records of IP usage (Plus Version)
Collect IP and MAC addresses of connected devices in the network and record
the online usage time of user IP, switch device name and port number of IP
connection, which is convenient for administrators to query internal IP usage
issues such as IP conflicts, IP usage allocation, and connection device location.
Query Syslog
It can receive the system logs from different brand devices, output the result
in regularized format after analyzing the log event categories, and realize the
querying logs function of various equipment on a single interface.
Network error detection (Plus Version)
Detecting network errors occurring on devices, helping administrators find out
network latency issues, thereby reducing the incidence of network problems
such as LOOPBACK, CRC error, and ERRORDISABLE occur detection.
Simulate user behavior
Through simulating user behavior to detect abnormal system services, such as
user login to the website behavior, simulating requirements DHCP, DNS..., etc.
Edge computing
For system design in special environments such as education networks and
large enterprises with many branches, the edge computing server can become
a regional management system and upload data to the central server for
centralized control.

Various notification types
Support Messages, E-mail, Window POP-UP, Sound alarm, LINE Messages,
Customize Trigger Actions…etc.
Application Programming Interface (API)
The network management system provides various REST API, and it can quickly
grab out all the monitoring data from the system through the API so that
enterprises are more accessible to integrate their systems, such as reporting
systems, repair systems, etc.