
Cyber Monitor is an intelligent network analysis and monitoring system based on Web technology. It supports different browsers and has a unified interface that can cross-brand systems for monitoring. It also supports automatically scanning the connected network device by cycle and automatically managing the devices without manually setting up for management. The network administrators can quickly configure and easily manage distributed network devices. Cyber Monitor has a friendly graphical interface that can display overall status information in real-time and provide early warning through proactive mechanisms. It helps administrators prevent abnormal occurrences and improve troubleshooting time.
![]() Single sign-on(SSO)
Single sign-on(SSO)
Existing accounts can be integrated to log into the network management platform, such as LDAP, AD, OPENID...etc. No additional account numbers and passwords are required.
![]() Group/layered management
Group/layered management
Group/layered management mechanism
To establish a network of enterprises/institutions/campuses with a tree structure. Building network entity architectures includes: Gateway, DMZ, Routers, VLANs, etc. Account permissions can be set for each management.
![]() Unlimited license
Unlimited license
No cap authorization can be stable can manage 500 to 1000 devices, 1000 to 2000 or more can also be monitored project optimization management, more than 2000 can also be monitored through the horizontal expansion of equipment.
![]() Device status monitoring
Device status monitoring
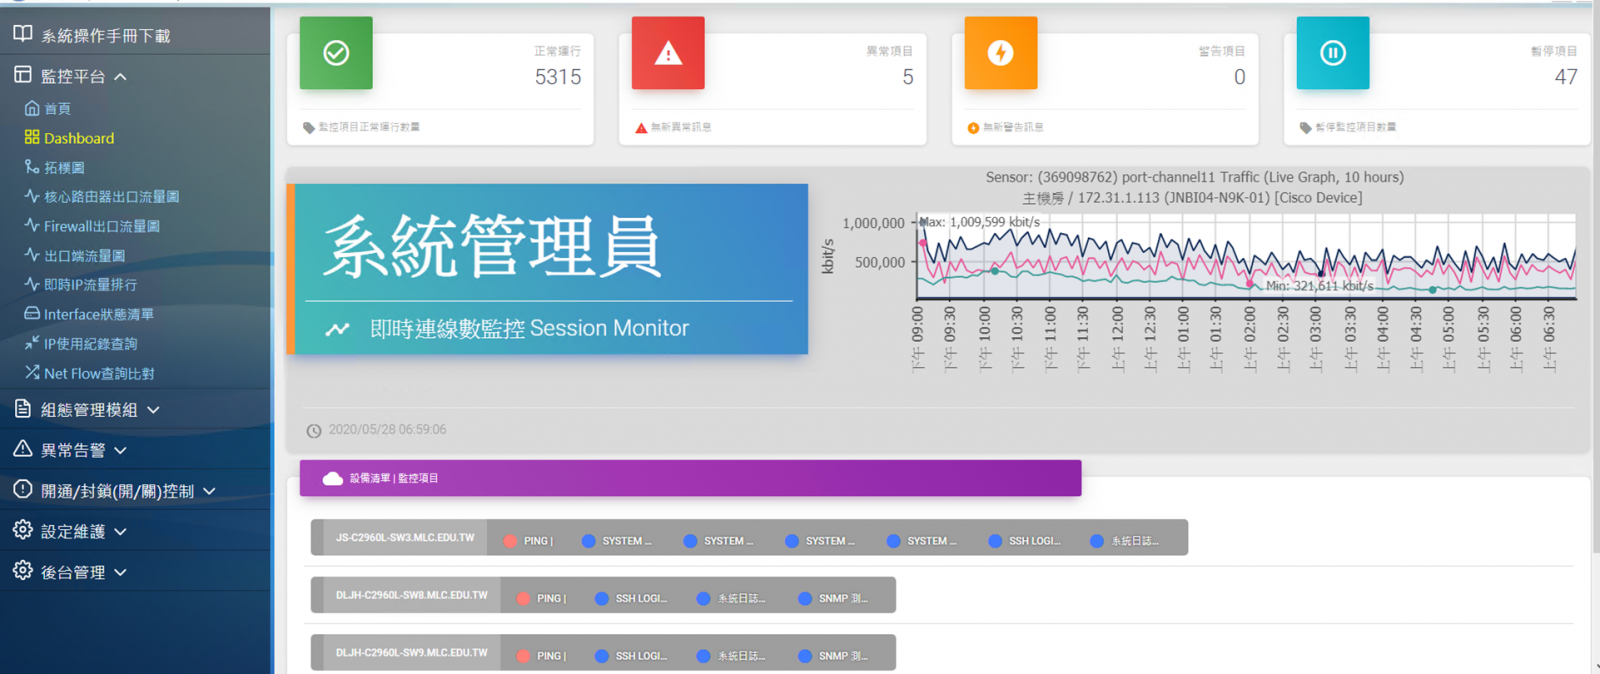
Monitor the health status of hardware and software, network activities, including CPU, MEMORY, TRAFFIC and so on.
![]() Early warning
Early warning
Automatic detection of networks, device values of unusual fluctuations early warning, rather than waiting for obstacles to notify, and automatically block abnormal IP traffic.
![]() Automate equipment management
Automate equipment management
Periodic scanning of devices in the network segment, automatically monitors new devices without manual setting, and regularly schedules device configuration profiles, which can be compared the differences.
![]() Real-time traffic monitoring
Real-time traffic monitoring
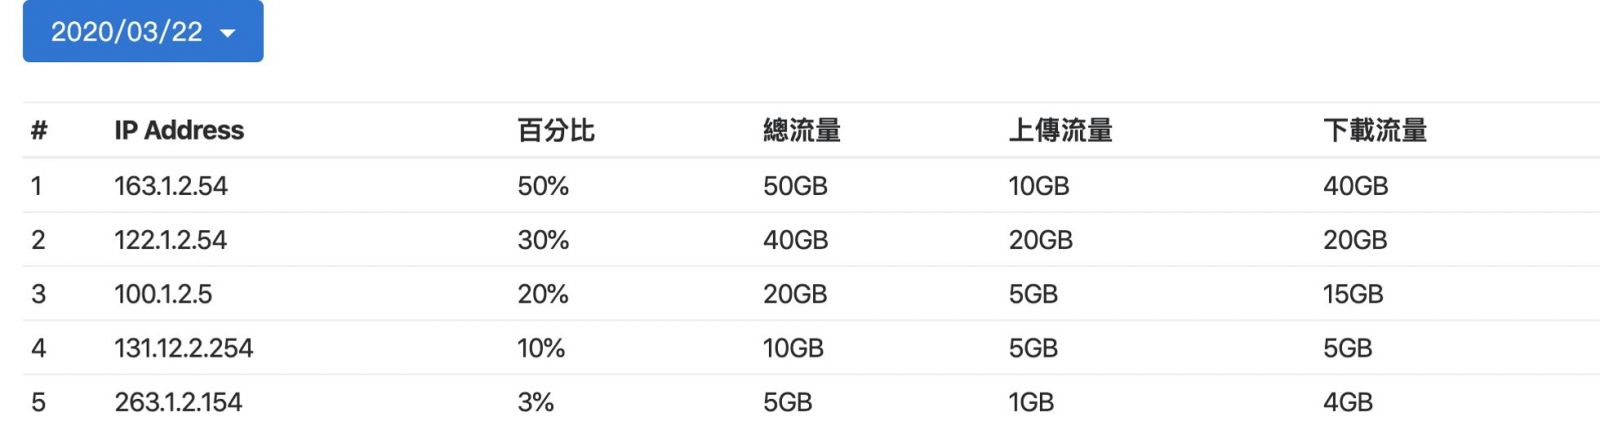
Real-time monitoring of network traffic utilization, through the traffic chart to show the maximum minimum value, query each client IP network usage and FLOW network connection source and destination flow.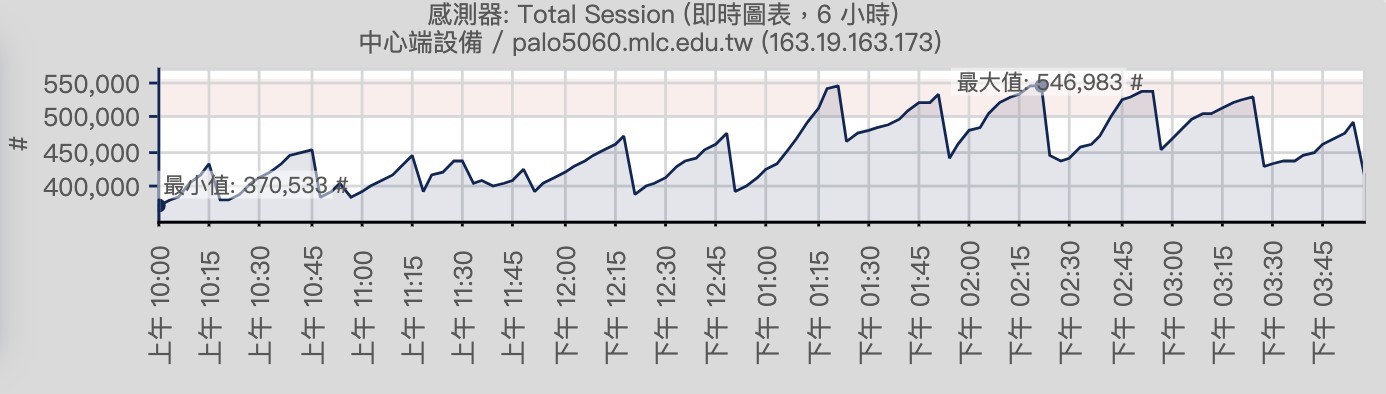
![]() Network topology
Network topology
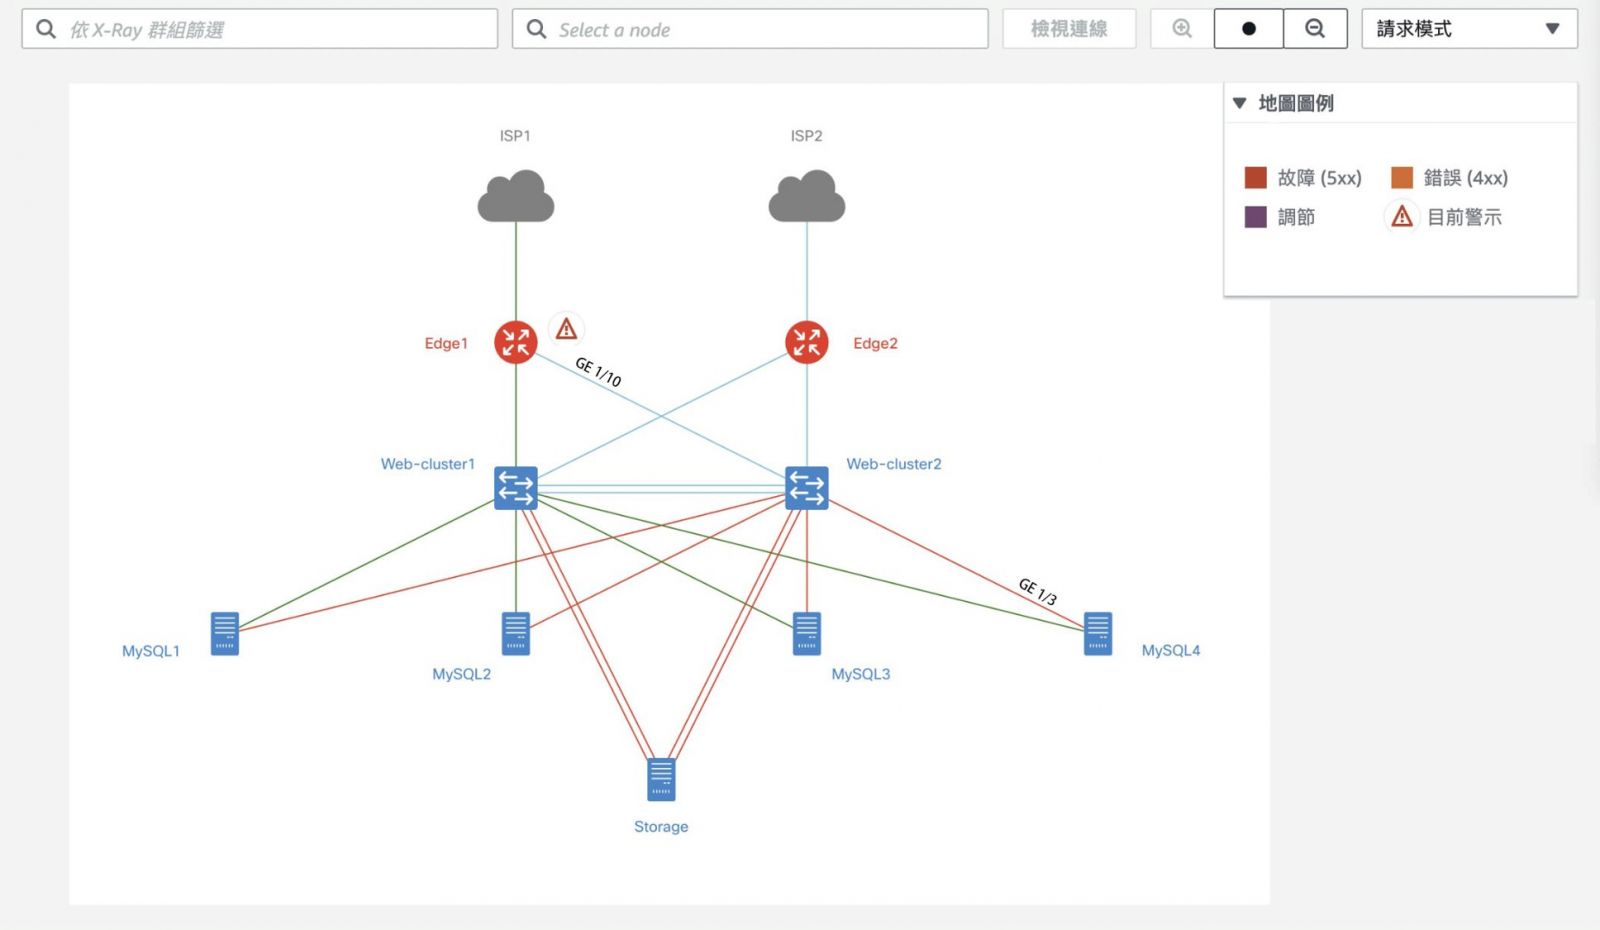
Automatically detect the connectivity of monitoring devices and draw network topology diagrams to visually view the monitoring status of the device and the status of the connection between the devices.
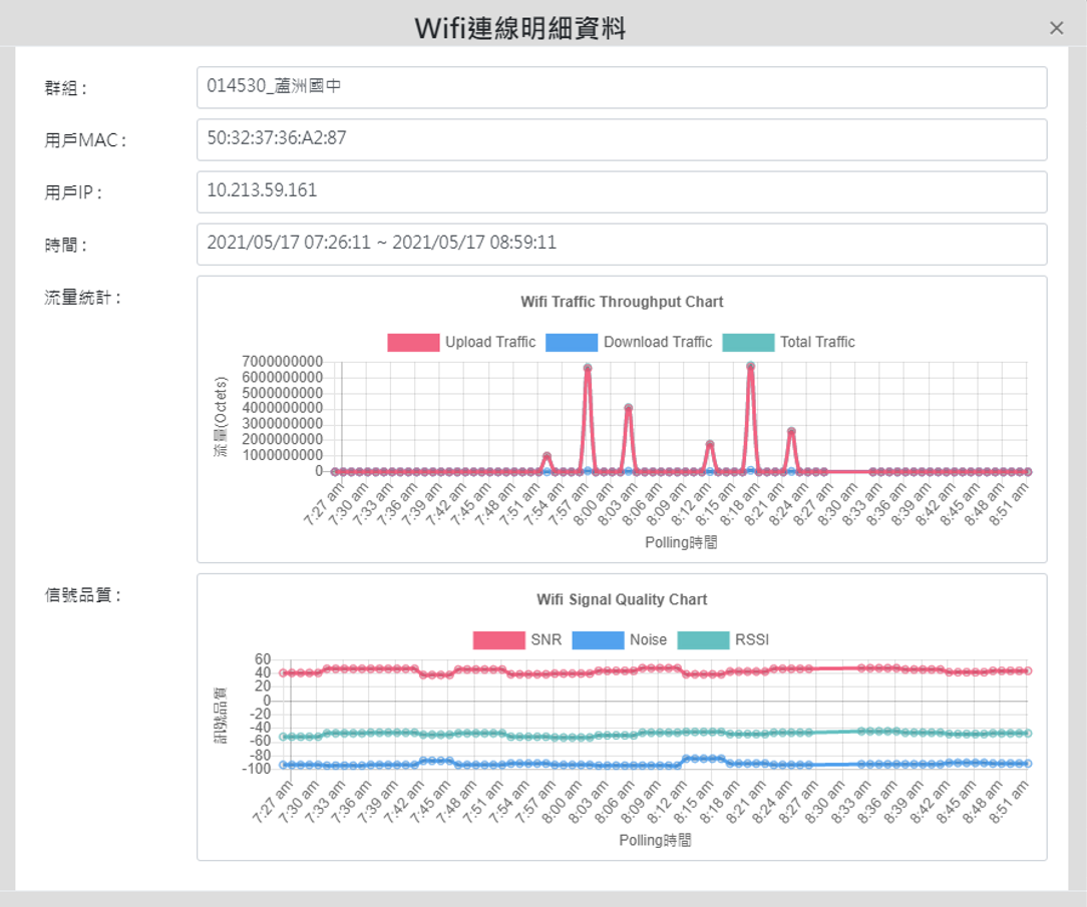
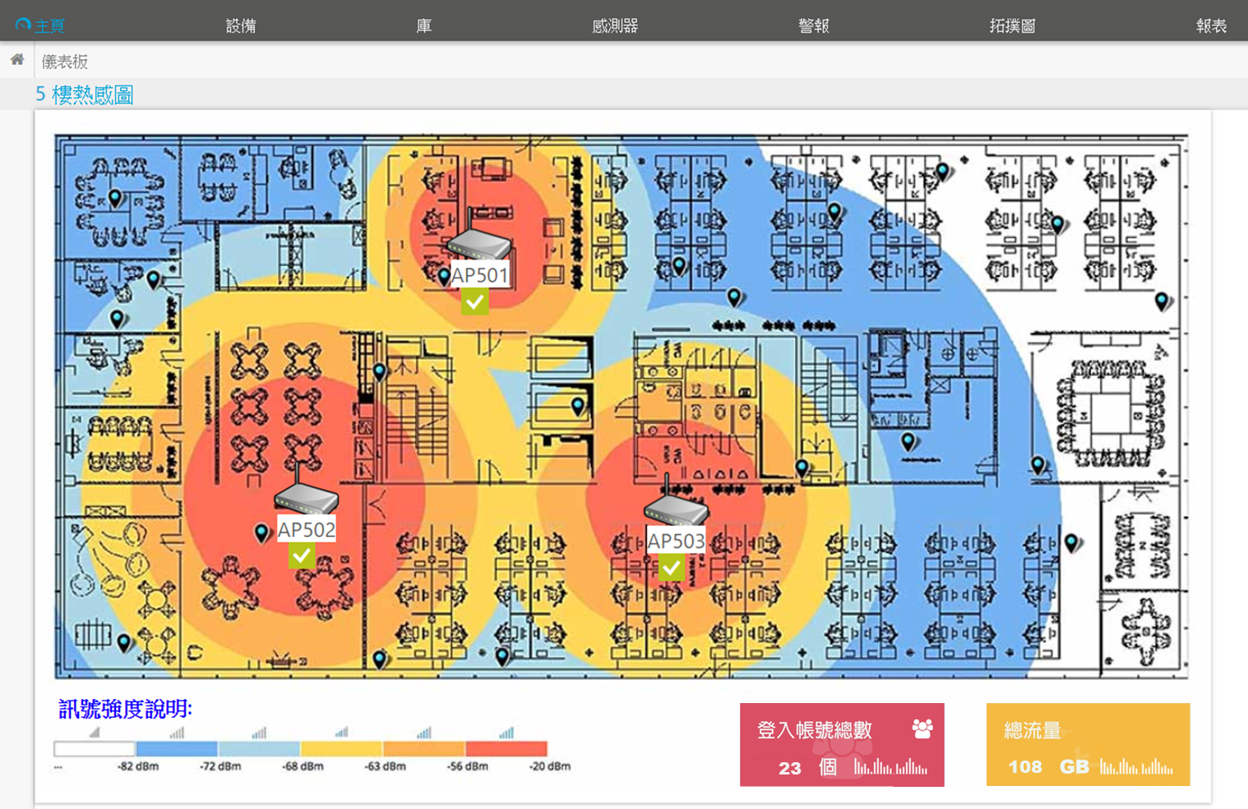
![]() Wireless network monitoring
Wireless network monitoring
Master the situation of WIFI users, analyze user WIFI traffic, device type, application distribution and signal strength, support loading the heat map drawn from the internal floor plan of the enterprise organization, and provide managers with visual view of AP status.。
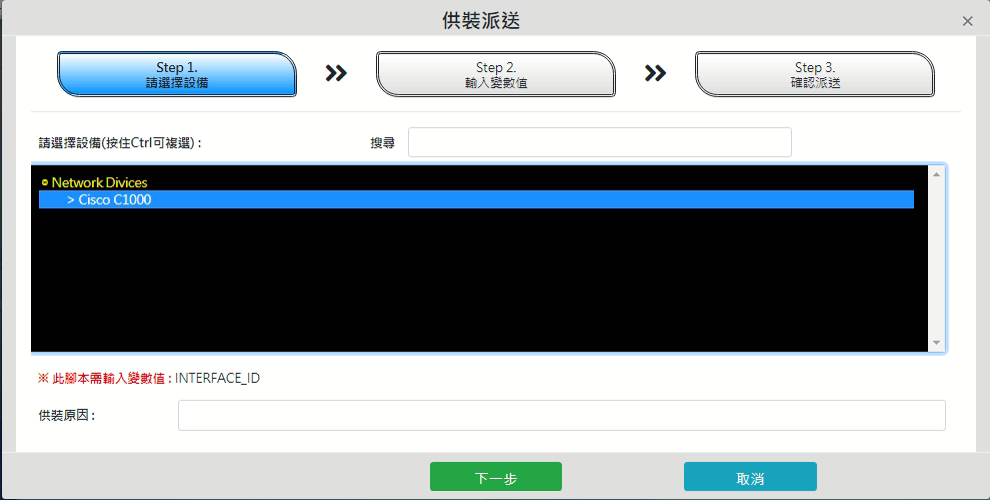
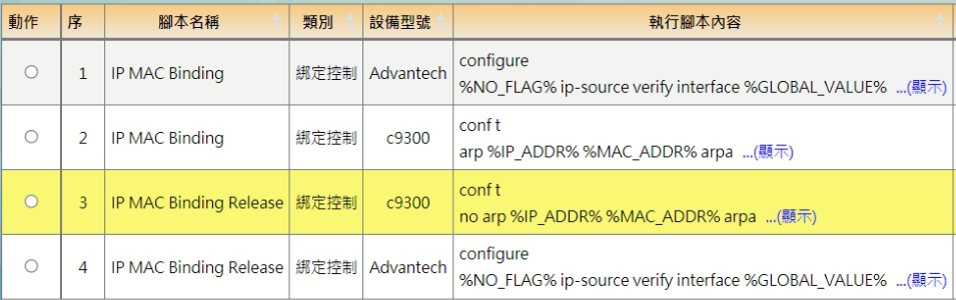
![]() Customize scripts
Customize scripts
Self-defined writing instruction scripting process, can be for different factory brand definition script, to achieve batch modification equipment secret, modify SSID, IPMAC binding and other purposes, only a single interface can operate all equipment, default several device models script.
![]() Customized equipment monitoring templates/items
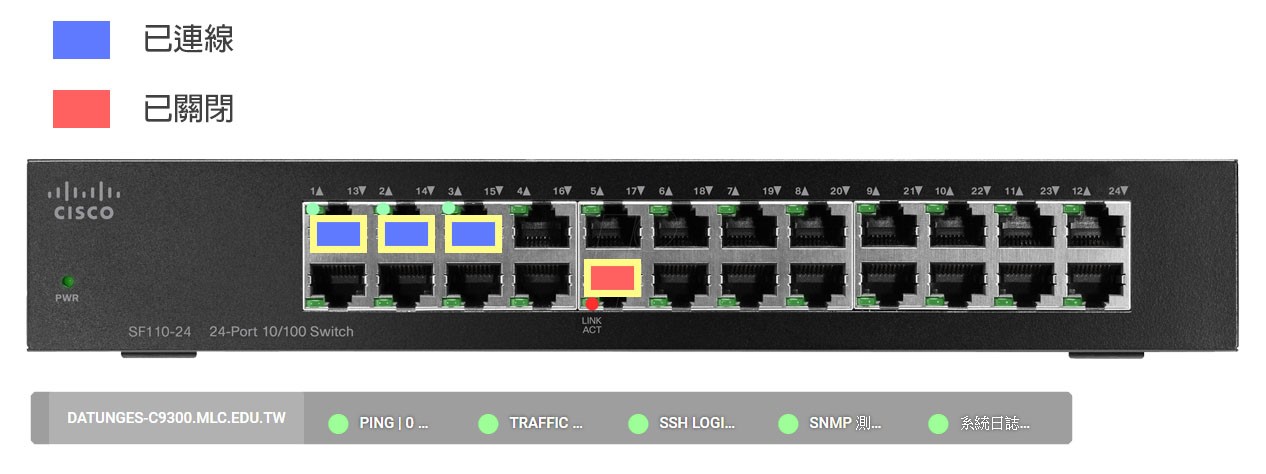
Customized equipment monitoring templates/items
Simulation device panel to see real-time port usage - connected, unwired, enabled, enabled, and monitoring project data, and custom proprietary monitoring project templates for special devices such as DB, VMs, service devices, etc. to enable organizations to master important service data.
![]() IP usage and modification records
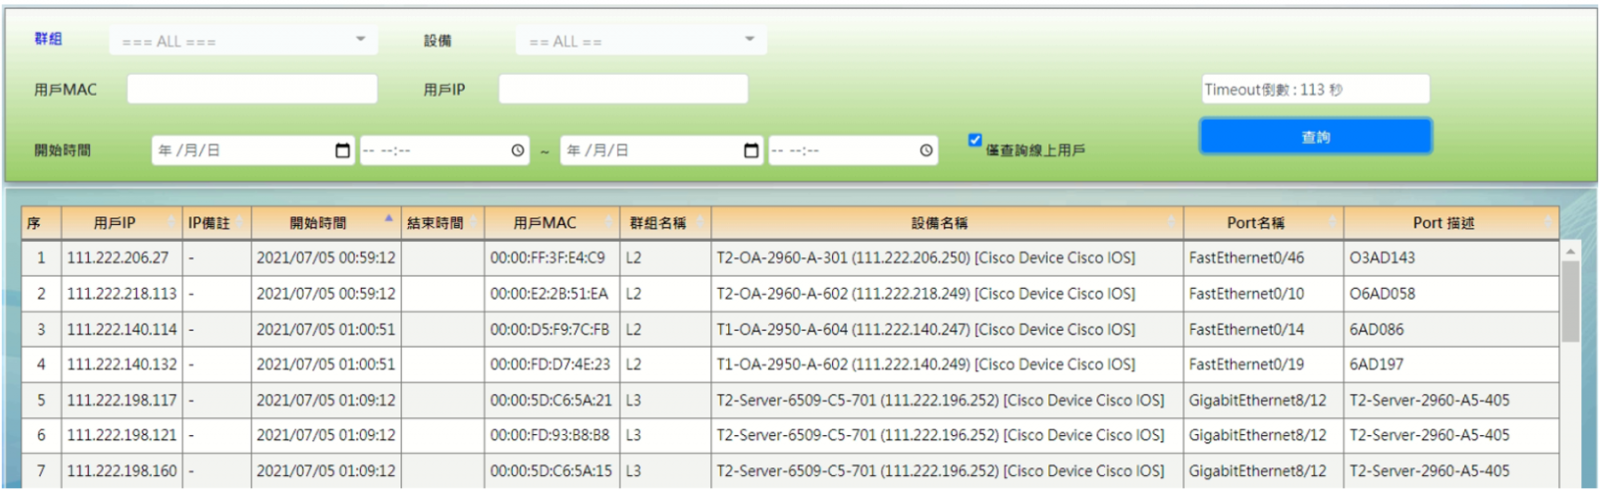
IP usage and modification records
Collect mac ADDRESS for all client IP and paired devices within the network, and record the time interval of their IP on-line usage, as well as the SWITCH device and PORT number to which the IP is connected, making it easy for enterprise organizations to query internal IP usage issues such as IP conflicts, IP usage allocation and device connection location.
![]() Firewall syslog analysis
Firewall syslog analysis
You can receive the system logs from different devices, output of the regularized format after analyzing the log event category, and realize the function of querying the logs of different devices on a single interface.
![]() Network error detection
Network error detection
Detecting network errors occurring on devices, helping managers identify network latency and other issues, thereby reducing the incidence of network problems such as LOOPBACK detection, CRC error detection.
![]() Simulate user behavior
Simulate user behavior
The way in which user behavior can be simulated to detect the abnormality of system services, such as simulating user login to the website behavior, simulating requirements DHCP, DNS... and so on.
![]() Edge computing
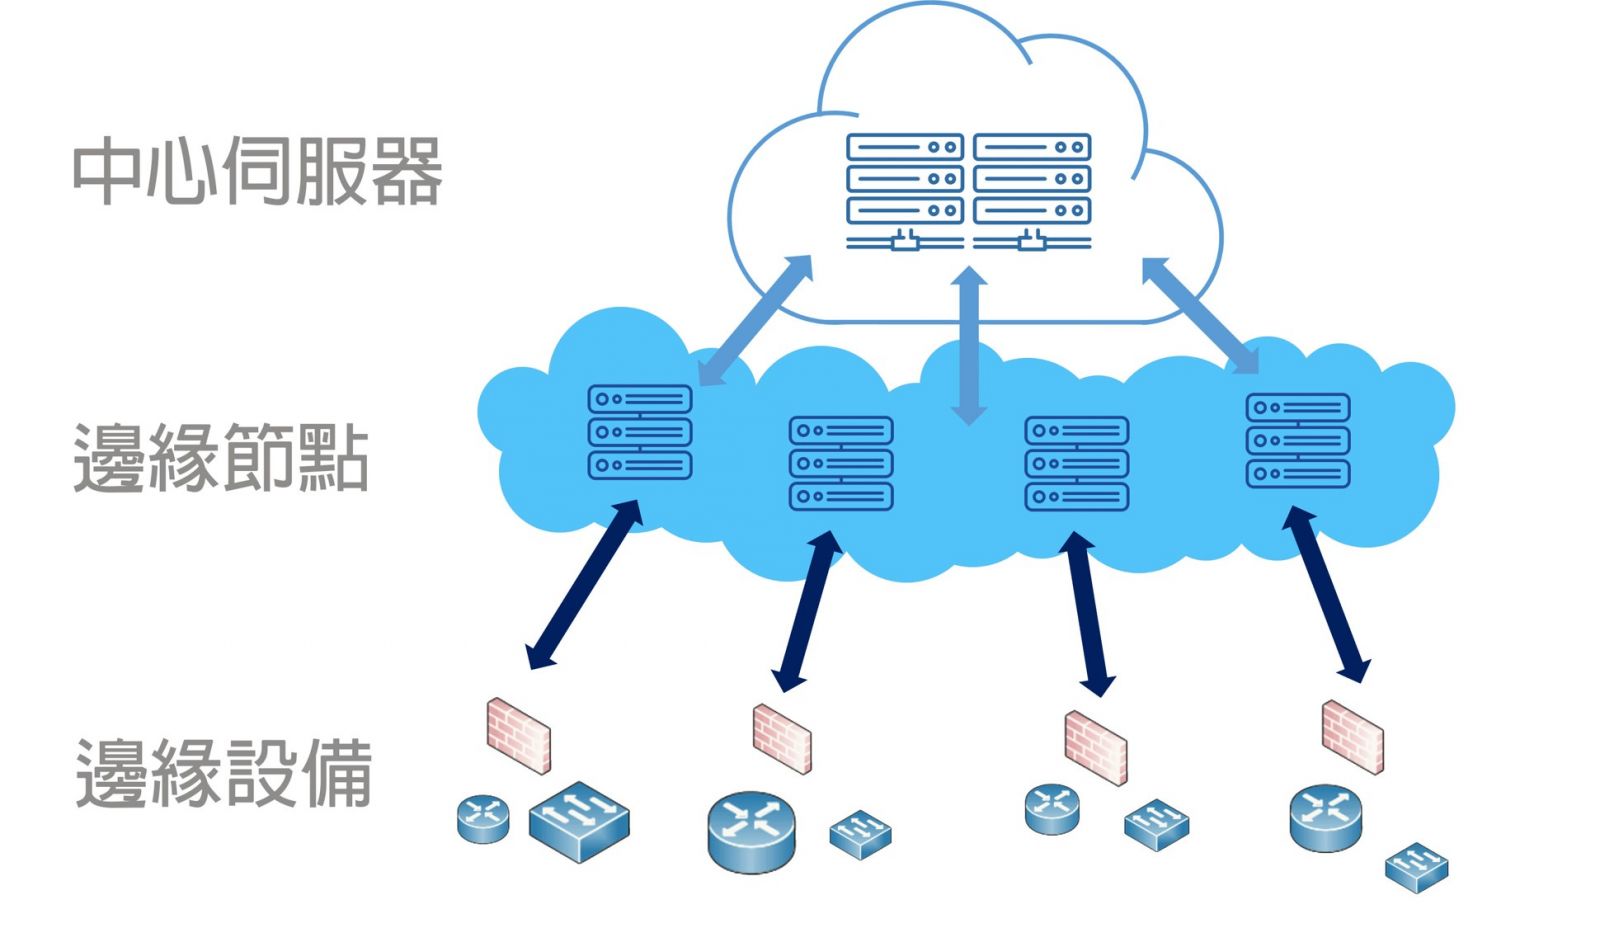
Edge computing
For the system design of the special environment such as the teaching network and the large enterprise branch, the edge computing server can be a zone management system, and upload the central server centralized control.
![]() Various alarm notices
Various alarm notices
Support Messages, E-mail, Window POP-UP, Sound alarm, LINE Messages, Customize Trigger Actions…etc.
![]() Application Programming Interface (API)
Application Programming Interface (API)
Network management system provides a wealth of RESTAPI, through the API can extract all the monitoring data of the system, so that enterprise organizations are easier to integrate their own systems, such as reporting systems, repair systems.